Last week, we shared with you the first part of our blog installment, 6 Facebook Page Statistics You Need to Know, based on our conversation with Emeric Ernoult, CEO of Agorapulse. See a full recap here and the continued list below.
Facebook metric #4: Storytellers
What is it?
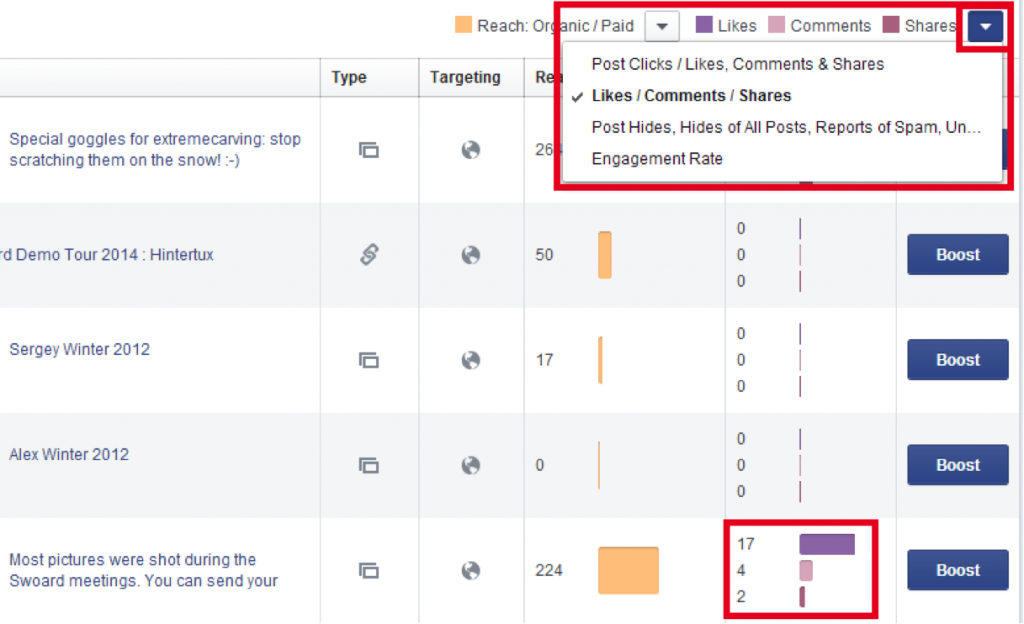
The “Storytellers”, called “People Talking About This” in the old insights, represents the people who have liked, commented or shared a post. The engaged users are all the users who have clicked anywhere on your post, the storytellers is the portion of these users who have clicked on like, comment or share.
As opposed to just clicking on a link, a picture or a video, liking, commenting or sharing a post will generate a story that will be published on Facebook for our friends to see.
What makes the “Storytellers” different than the mere engagement metric is that engagement in this case potentially generated a publication by that user showing his engagement to his friends.
Where can I find it?
Here again, go to your insight interface at the same place where you spotted the organic reach and the engagement and look at the “Engagement” column after having selected “likes / comments / shares” in the drop down menu. Easy.
Why it matters?
This is the “viral” metric. Going back to the roots of your motivation for investing in a Facebook page was probably the dream that you could connect with the friends of your existing fans for free! That metric is the best one to measure how many people are willing to spread the word about you to their friends.
In plain English, if a user likes, comments or share a post on your page, Facebook may publish to his friends that this user (their friend) liked, commented or shared a piece or content from your page. I emphasize the “may” because Facebook is limiting the reach of these stories very seriously. That is probably why if you used to see in your newsfeed that such and such friends had liked, commented or shared a piece of content from a page, you probably see less and less of that today.
So, even f you still need to follow that metric, don’t expect too much from it. Facebook is still the best place to leverage virality, but it’s not the eldorado it used to be.
Facebook metric #5: Clickthrough rate (or “consumption”)
What is it?
Here comes a metric that you are used to! CTR, or Click Through Rate has been around for years on the web and is used to measure the effectiveness of email marketing, banner advertising, search engine ads such as adwords campaigns or landing page quality.
The good news is that it means the same thing within Facebook. This will tell you the number of people who have clicked on a link in your content, watched your video or viewed a larger version of your photo.
Where can I find it?
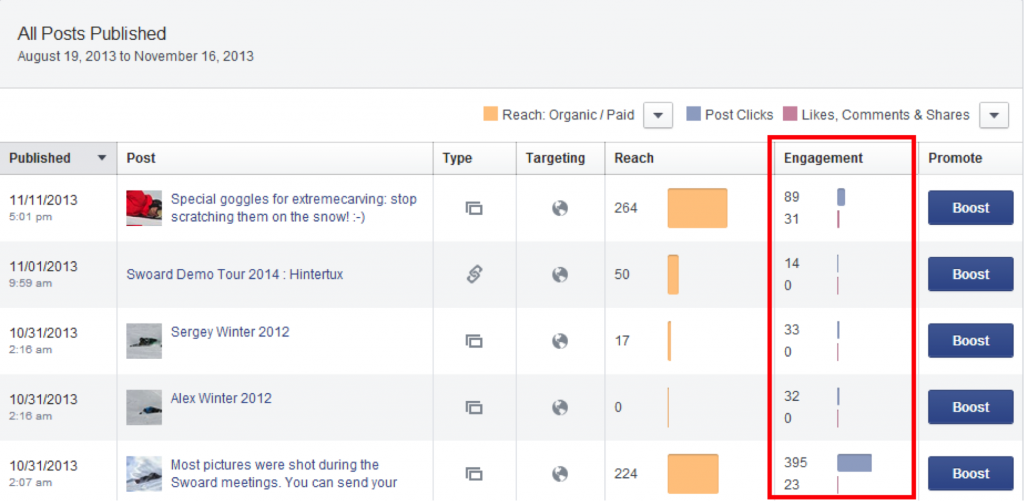
Go to your page insight interface, click on the “posts” menu and you’ll find the number of users who have clicked on your content.
Why it matters?
It is nice to know how many people have potentially seen your content (the reach metric), even nicer to know how many of them were interested enough to act on it (engaged users), but the bottom line is really to know how many people were actually interested enough to pay real attention to your content. And that means watching your video, looking at your photo or checking out your link.
That is the bottom of your “content quality” funnel. Keep an eye on it.
Facebook metric #6: Negative Feedback
What is it?
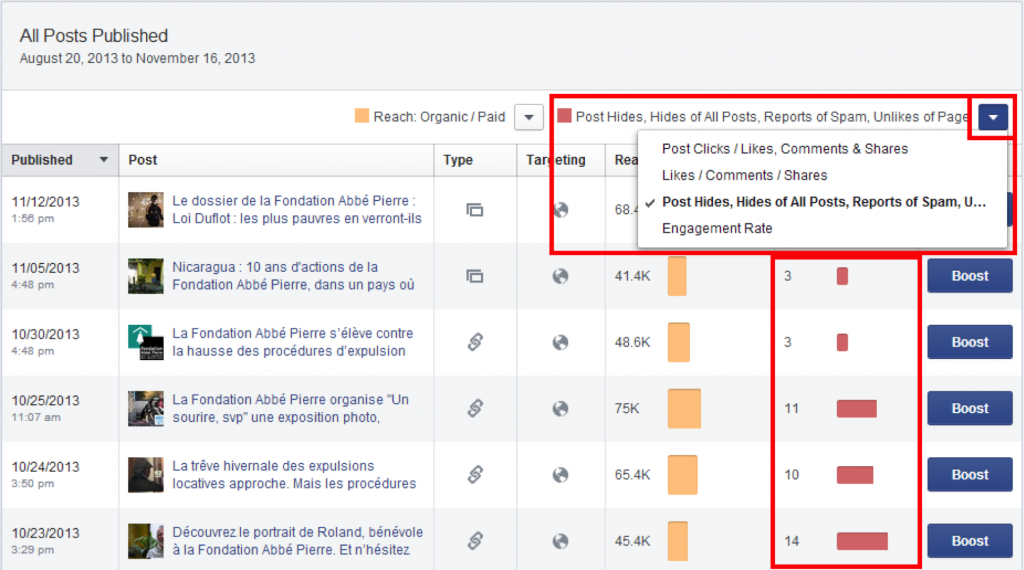
Negative feedback is a “negative” action taken by a fan on your piece of content. It can be hiding that specific post, hiding all future posts from your page, unliking your page or worse, reporting it as spam. Simply put, it counts the number of users who really did not like your content or the fact that it appeared in their newsfeed.
Where can I find it?
Go to your page insight interface, click on the posts menu and look at the “Engagement” column after having selected “Post Hides, Hides of All Posts, Reports of Spam, Unlikes of Page” in the drop down menu.
Why it matters?
Since September 2012, Facebook has given much more weight to the negative feedback metric. In other words, posts with a high negative feedback will have much less exposure through edgerank and, pages with an average negative feedback that remains high will have less and less reach over time.
Needless to say that if you want to stay in the game of Facebook marketing, you need to keep that number as low as possible.
Conclusion: Measuring your Facebook page performance may seem like a daunting task if you have to do it manually from the Facebook insight interface or the Excel download, but it is good to start doing it that way to really have a feeling of where the data come from and what they mean.
Once you start being familiar with them, you can use third party tools that will help you save time and get right to the point. One free tool Emeric recommends l is the Facebook page barometer, but for more detailed metrics, you can also try the Facebook page management suite at www.agorapulse.com.
What metric are you paying attention to and why? Do you do that on Facebook directly or do you use a tool?
Like what you see here and interested in learning more? Join OMI and Agorapulse for a free webinar, “Facebook Metrics: Measuring Your Content’s Performance”, tomorrow Thursday, June 12th at 11:00 am ET.


